Generalized Learning Vector Quantization
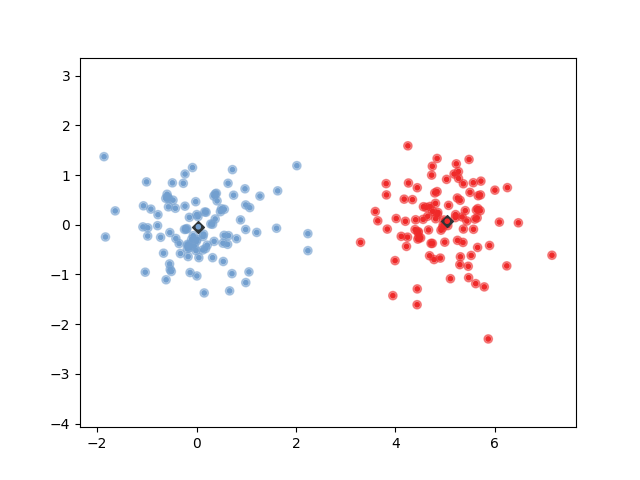
This example shows how GLVQ classifies. The plot shows the target class of each data point (big circle) and which class was predicted (smaller circle). It also shows the prototypes (black diamond) and their labels (small point inside the diamond).
Out:
GLVQ:
('classification accuracy:', 1.0)
import numpy as np
import matplotlib.pyplot as plt

from glvq import GlvqModel
from glvq.plot_2d import to_tango_colors, tango_color

print(__doc__)

nb_ppc = 100
print('GLVQ:')
toy_data = np.append(
    np.random.multivariate_normal([0, 0], np.eye(2) / 2, size=nb_ppc),
    np.random.multivariate_normal([5, 0], np.eye(2) / 2, size=nb_ppc), axis=0)
toy_label = np.append(np.zeros(nb_ppc), np.ones(nb_ppc), axis=0)

glvq = GlvqModel()
glvq.fit(toy_data, toy_label)
pred = glvq.predict(toy_data)

plt.scatter(toy_data[:, 0], toy_data[:, 1], c=to_tango_colors(toy_label), alpha=0.5)
plt.scatter(toy_data[:, 0], toy_data[:, 1], c=to_tango_colors(pred), marker='.')
plt.scatter(glvq.w_[:, 0], glvq.w_[:, 1],
            c=tango_color('aluminium', 5), marker='D')
plt.scatter(glvq.w_[:, 0], glvq.w_[:, 1],
            c=to_tango_colors(glvq.c_w_, 0), marker='.')
plt.axis('equal')

print('classification accuracy:', glvq.score(toy_data, toy_label))
plt.show()
Total running time of the script: ( 0 minutes 0.074 seconds)